Quantcast
Channel: The SlideTeam Blog
Viewing all 4719 articles
Browse latest View live

PowerPoint Tutorial #12- How to Design Harvey Balls in Just a Minute!

$
0
0

Your presentation is just after two days and you are all messed up! Have to talk specifically about the qualitative information and yet you don’t know how to go about it. Fret not. We are here to give you a solution to your problem.


It is always an easy job to explain any kind of quantitative information.  You can talk about numbers, sales, figures in an effortless manner. It becomes troublesome when it comes to explain things like quality, safety or taste. Since most of us are not aware what PowerPoint template should we use to describe these, we often end up writing our information on a white plain slide. To sum up, describing any kind of qualitative information is not everybody’s cup of tea.


Hence, the solution to this problem is Harvey Balls.  Harvey Balls are used for visual communication of qualitative information. They are frequently used in comparison tables. Harvey Balls are a great means to show the visual status update across a list of items. Therefore, add Harvey Balls in your presentation, explain each and every point with a great visual and leave your audience amazed.


What You’ll Learn to Create in this Tutorial:

Harvey ball diagram for qualitative analysis


It can be used for any presentation where you are showing comparison and qualitative information. Here’s an example of how 4 most popular smartphones fare against each other on the usability factor:

Smartphone comparison with harvey balls


Look at the above diagram. Visual describes everything. Presenter does not have to put efforts to explain each and everything to the audience. So sit back, relax and pay attention to the steps of creating Harvey Balls diagram for your presentation.


Steps to create Harvey Ball Diagram:


1. Insert an Oval Shape from the shapes menu. Insert> Shapes> Basic Shapes> Oval Shape. Press Ctrl + Shift to draw a symmetrical circle.

Insert an oval shape


2. Duplicate the original Oval shape by pressing Control C and Control V.

Copy paste the oval shape


3. Select the duplicated oval shape. Go to the Format tab> Edit Shapes> Change Shape> Pie chart. Place the pie chart over the duplicated one.

Place pie chart over the duplicated oval shape


4. Select the original oval shape. Right click the image. Fill> No Fill.

Remove the fill color of the original shape


The Harvey Ball is ready:

Harvey ball


5. Move the yellow handles to get different shapes of Harvey Balls. See the below image to get a clearer picture of what you have to do.

Move the yellow handles to get different shapes


6. Add the colors of your choice in the diagram. Right click the image> Fill> Choose Color.

Change the colors


Here is the customized Harvey Ball which took just a minute to create.

Simple harvey ball


No more worries now. Create your own customized Harvey Ball design in just 5 minutes and don’t leave any chance to impress your audience. In case, you don’t have much time to create the PowerPoint Presentation, we have done our research and handpicked our best designs for you. Take a look:


Professional PowerPoint Template #1

Four staged balls with change over time PowerPoint template slide

Grab this creatively designed PowerPoint Template by clicking here.


Professional PowerPoint Template #2

Harvey balls for data representation flat PowerPoint design

Download this simple Harvey Balls PowerPoint Template by clicking here.


Professional PowerPoint Template #3

Harvey Balls PowerPoint Presentation

Download this awesome diagram and pass on your information to the audience easily.


Professional PowerPoint Template #4

Harvey Balls PowerPoint Template Slide

Grab this Harvey Ball PowerPoint Template by clicking here.


Professional PowerPoint Template #5

Three different pie charts for result analysis PPT  template

Download this creatively designed PowerPoint Template and leave your audience stunned.


Professional PowerPoint Template #6

Bar diagram and harvey balls to show quarter percentage track record

Grab this eye catching diagram by clicking here.


Professional PowerPoint Template #7

Creative Harvey Balls PowerPoint template

Catch your audience’s attention with this awesome diagram.


Professional PowerPoint Template #8

Harvey Balls flat PowerPoint design

Grab this eye catching template by clicking here.


Share your feedback with us and stay tuned for more creative PowerPoint Tutorials.


PowerPoint Tutorial #13- Make an Impressive Speedometer Dashboard Design in Just 5 Steps

$
0
0

Speedometer. Immediately, an image of automobile's speedometer flashes in our mind. This simple tool used to demonstrate the graphical indication of rise and fall in the speed of the vehicle is a life saver! Did you know speedometer gauge is a life-saver for business presentations too?


Yes. After all, who likes to see a sales or marketing presentation full of mind-boggling numbers! The speedometer dashboard is the perfect visual metaphor to showcase the speed of your projects or annual performance measured against KPIs and goals. Moreover, the digital speedometer gives real-time information of your organization sales and production figures in a creative manner.


Give rest to your rushing thoughts. For in this tutorial, we are going to show you how to create an outstanding Speedometer design on your own. Grab all the eyeballs you need and let your audience learn the details of your business performances at a glance.


Here you’ll learn to create this design:

Speedometer Diagram PowerPoint Tutorial


Steps to Create Speedometer Dashboard/ Gauge Diagram:


1. Insert a Doughnut chart. Click the Insert Tab > Chart > Pie > select Doughnut. (In PowerPoint 2010, Doughnut is a separate chart option. In 2013, it is included within the Pie chart.)

Insert Doughnut Chart


2. Edit the Chart (Excel Sheet). First, determine the number of levels/markers you need in your speedometer design. Say you need 6 to measure performance- Excellent, Very Good, Good, Average, Poor and Very Poor. You need to put double the number of entries in the Excel chart. Replace the sales values with 1 unit and do it till serial number 13 (since the first row is occupied by titles).


Note: Remove the title Sales and quarter numbers from the chart you see on the slide. Select them and press delete.

Edit the doughnut chart


3. Customize the Doughnut shape. Double click on each data point in the lower base of the doughnut, right click, go to Format Data Point > select No Fill > No Line. The final shape will look like this.


Edit the Data Points


That’s it! You have the 6 levels you needed on your slide. The lower half has merged into the background. If you are using a colored background, then fill the lower half levels with the same color to make them merge into the background.


4. Design the Needle. Follow these steps to create the speedometer needle:


  • Create a base by first going to Insert Tab > Shapes > Select the Oval (Press Ctrl + Shift to draw a perfect circle).
  • Create the pointed edge by again clicking the Insert Tab > Shapes > Select Isosceles Triangle. Now place it over the circle. To get the pointed edge as shown, select the trianglepress Ctrl and drag inward (see the screenshot for your assistance).

Create a Needle


  • To give this needle a professional look, select both the shapes, right click and go to Format Shape > Solid Fill > Black> select No Line.

Format the Needle Shape


5. Align the gauge and the needle. Last but not least, select the shape and needle. Now go to the Format Tab > Align > Align Center. After this, if needle is still not at right position, then place it at the middle of the shape by dragging.

Align needle to Center


  • Rotate and place the needle on the desired level using the rotation handle of the triangle (click on the triangle and you can see the handle on top). However, after rotating if the base of the triangle is not on the circle, then select the triangle and drag it to adjust over the circle.

Rotate the Triangle


  • You can keep the default colors of the shape, or alter them to meet the needs of your presentation. To vary colors, follow these steps :-
    • Double click on a data point.
    • Go to Format Data Point > Fill > Solid Fill > Select color.

Repeat these steps for other points too.

Alter the color of data points


You can now use this gauge to plot percentages, quality of performance, speed values or any other variable that you require. This professional speedometer dashboard tutorial will now help you convey the right message to your audience aesthetically and easily. Need more gauge designs? Have a look at our readily available Speedometer PowerPoint Templates below:


Professionally Designed Speedometer Dashboard or Gauge Diagrams:


Speedometer Dashboard Template Design #1

Speedometer Gauge dashboard PowerPoint Template

Download this Speed dashboard PPT template from here.


Speedometer Gauge Template Design #2

Business Progress Growth Speedometer Slide

Click here to download this innovative gauge dashboard PowerPoint template.


Gauge Template Design #3

Low-High Medium Speedometer Dashboard PPT

Download this awesome speedometer presentation slide by clicking here.


Speedometer Dashboard Template Design #4

Editable Speedometer Dashboard PowerPoint Slide

Click here and download this gauge dashboard PowerPoint presentation template.


Gauge Dashboard Template Design #5

Assess Supply Chain Gauge Dashboard PowerPoint Template

Click here to download this creative speedometer dashboard PPT.


Speedometer Dashboard Template Design #6

Awesome Speedometer dashboard PPT template

Click here to download this stunning speedometer dashboard PPT template.


Gauge Dashboard Template Design #7

Executive gauge dashboard PowerPoint templates

Download this executive speedometer dashboard PowerPoint slide from here.


Speedometer Gauge Template Design #8

Percentage gauge dashboard presentation slide

Browse here to download this professional gauge presentation template.


How did you like our PowerPoint Tutorial on Speedometer Gauge? Share with us your feedback in the comments below.


Uncle Sam’s Hat and 12 Other Fourth of July Accessories to Spice Up Your Presentation

$
0
0

Happy 4th of July in advance. 4th of July, 1776 has been declared and celebrated as the birth of American Independence. Time to celebrate freedom, power and independence. We bet you are all set to celebrate this occasion with the coming extended weekend holiday with parades, concerts, barbecues, baseball games and fireworks in New York City.


Begin the celebrations just now, but we also want you to have a joyous week ahead with your work, business meeting and business presentations. As far as the presentations are concerned, how about giving it a feel of elation, blissfulness and independence? How about adding Fourth of July accessories to your presentation all the month of July? That will be such a pleasant surprise for the audience!


SlideTeam offers you a wide range of Independence Day PowerPoint Templates. Download these wonderful PowerPoint Templates and learn to up your game. Let us show you 13 ways you can beautifully integrate creative and unique 4th of July accessories in your presentation.


Fourth of July Accessories for Presentation


1. Uncle Sam

Uncle Sam is pointing at you and saying I want you. Not for the U.S. army though this time but to celebrate the Independence Day. Suit up, pack your briefcase, and get ready for your presentation with the Independence Day PowerPoint Templates. Every celebration is incomplete without mentioning Uncle Sam. Share some fun facts about Uncle Sam in an interesting manner. Since you will most probably be wearing Uncle Sam’s hat as a costume accessory, don’t forget to use this accessory in your slides too!

Uncle Sam's Hat for Fourth of July


You can play around with the colors, text and icons as per your requirement. Customize the PowerPoint Template as per your need and save the applause for the end. Grab this awesome Uncle Sam’s PowerPoint Template by clicking here.


2. Statue of Liberty

One thing that completely symbolizes America’s cherished freedom is the Statue of Liberty. It clearly represents the icon of freedom for the people of United States. You can very well use the below template to showcase the freedom rights of the citizens of America. Freedom Rights Americans Enjoy


Not only this, you can also share the past when France gifted the Statue of Liberty to the United States and other fun facts related to it in the given rectangular shape boxes. We have created this diagram by adding the Statue of Liberty from this template (Slide no.1). You can also add this beautiful Statue of Liberty diagram and customize your own layout by playing around with rectangular boxes and colors.


3. Maps of United States

Donald Trump is one gem of a person and Hilary Clinton is one substantial personality.  Not taking any sides, but Donald Trump’s comic timings are impeccable.  Well since everyone is debating who is on whose side, we created an ideal visual for you through which you can show how many States are in favor of Democratic Party and how many are in support of Republican Party. By the way, whom are you rooting for?

American States to vote for their favorite Presidential Candidate


Make changes as per your requirement and blend it well with your presentation. Download this editable United States Map PowerPoint template and stun your audience.


4. Circle Frame in Festive Style

Let’s go back and remember the founding father and the leader of American Independence, John Adams. Quote him using the circle frame and proudly begin your presentation. Add your logo, customize the color and font if you wish to. Be ready to stun your audience.

Remember the legend on the Fourth of July


Click here to download this diagram.


5. Number 4 

It is always good to recall the moments of happiness. Recollect those memories of the heroes who fought for the country till the end. If you are a history person, grab this eye catching PowerPoint Template and make your audience aware about the history of American Independence. Also for the students and teachers, this one is just an ideal diagram for you to write down your thoughts about the Independence Day.

History of American Independence


Isn’t the above layout just perfect to talk your thoughts? You can make changes in the template and experiment with the colors, text and font size. Add your company’s or organization’s logo to make it look perfect. Grab (Slide no.2) this eye catching PowerPoint Template, add your content and amaze your audience.


6. Ribbon with American Flag
Talking about facts that people might not be aware of is not a bad idea at all. Especially, students of freshmen or sophomore year generally do not pay a lot of attention in school. Fun way of increasing their general knowledge is here. Impart some knowledge, facts and history of the American Independence in a creative manner. Just integrate the perfect visual in your presentation and you are good to go. See the below image for your reference.

Facts related to the Fourth of July


This PowerPoint Template will make your work easy. It will immediately grab your student’s attention and would turn the boring class of history into an interesting one.  Download this PowerPoint Template, customize it the way you want and share your knowledge with the people.

Get this awesome PowerPoint Template by clicking here (Slide no. 10) and keep your audience engaged.


7. Dollar

Let’s admit- who doesn’t love dollars? This powerful currency has a strong impact on the world’s economy, GDP and what not. Undoubtedly, dollar is the king of all the currencies, it works everywhere in the world. Discuss what factors influence dollars with your clients and colleagues visually. Explain those factors with less use of words but with the right visual.

Factors that determine dollars


Add your logo, make changes as per your requirement and then let your presentation speak for you. Click here to download this diagram.


8. Colorful Arrow

The right way to keep up the momentum of the colleagues is to keep inspiring them. Every week, you prepare your presentation for the same but that goes all in vain, when your colleagues either reach out to their cellphones or watch. Nothing to worry about. We are here to help you out. Instead of putting down the lines on a white slide, write them on an amazingly designed PowerPoint Template just like the below image.

Steps to climb the ladder of success


Isn’t it looking great? We bet, you agree. Motivate them with the help of this great diagram. Showcase the ladder of success in style. Inspire your colleagues by showing the right inspirations. Put your logo on the slide, customize it as per your requirement and you are ready with your Monday presentation. Grab this amazing PowerPoint Template by clicking here.


9. Umbrella of America

One thing which everybody desires for is Financial Security. With money, comes everything. How do you depict security? Umbrella is the right visual metaphor to do that. Clearly show the steps of financial security or any other security for that matter this presentation season with the below colorful umbrella:

Financial Security Umbrella


Go ahead, download this amazing template, customize it, add your favorite colors and give an awesome presentation. Click here to download this diagram.


10. Colorful Slippers

It is not tough to see why people want to visit USA at least once in their lifetime. It has great impressive diversity of landscapes, iconic cultural sights, great food and friendly people. New York is topping the charts of places people want to visit for obvious reasons. However, we have also picked one creative slide for you where you can show to the tourists 5 destinations they must visit, or 5 favorite spots of tourists or anything specifically you wish to add.

A trip to USA


Doesn’t it make you feel the urge to immediately pack your bags and head straight to the USA? It completely does. Add this creative PowerPoint Template, customize the color, text and icon as per your requirement and inspire your customers to book their tickets right away. Grab this PowerPoint Template by clicking here (Slide no. 9).


11. Shopping Cart

Show people the best months to buy everything in America. Yes, the long queue, snowfall, covering yourself with a warm rug everything is worth the wait when the gate opens up at the midnight or early morning at 6 A.M. Retail outlets are jam packed in the holiday shopping days. You can incorporate the appropriate template to showcase the busiest days for shopping.

US Shopping Facts


The above image clearly indicates the best shopping days. Customize the above image as per your requirement. You can change the color, text and icon of this PowerPoint Template as per your need. Add your logo and then you are done. Let your presentation do the rest of the work for you. Download this diagram by clicking here.


12. Innovation Bulb

Think outside the box, brainstorm, get more ideas etc. etc. This is you saying your colleagues in screeching voice of yours. But does it help when your own presentation is boring to death? Well let’s just leave this right here. We have found the best way for you to motivate your colleagues for the brainstorming session this July.

Tips for idea generation


The above diagram is completely apt for the idea generation tips. You can help your colleagues by showing this visual. Other than this, you can also discuss other various topics such as tips to have a successful startup, ideas for new business and much more. This template has bulb in it so you can discuss various inventions too. Do not forget to mention Thomas Edison, great American Inventor who invented electric light bulb! Grab this amazing PowerPoint Template by clicking here.


13. Balloons

We really appreciate that you took out time for us and bear with us this whole time. This is how mostly people end their meetings and presentations. However, we would like to end our blog post with a special visual. You can use this too for your July presentation:

Say Thank You in  American Style


This is indeed a nice way to end any presentation. You should do it too next time. Add this awesome PowerPoint Template in your presentation and leave a great impression on your audience. This is again a customizable PowerPoint Template. You can make changes in color, text as per your requirement. Save this for your presentation and wait to hear an applause for yourself. Click here to download this diagram.


We are about to conclude our post for you. You can also look around at our website www.Slideteam.net for Independence Day PowerPoint Template collection. Pick the one’s which suit you best.

Take a look at our handpicked Independence Day PowerPoint Themes which can help you keep your audience engaged in your presentation.


Stunning Fourth of July Themes


Theme no. 1

Happy Fourth of July

Click here to download this awesome PowerPoint Theme.


Theme no. 2

Happy Independence Day

Download this diagram by clicking here, add your content and catch all the eyeballs from the audience.


Theme no. 3

It's the Fourth of July

Click here to download this diagram.


Happy making Presentation and Happy Independence Day.

God Bless America!!

PowerPoint Tutorial #14- How to Create the Perfect Dartboard Diagram for your Presentation

$
0
0

When it comes to pen down goals and objectives, business presenters end up writing them on a blank slide. So uninspiring and boring! To invigorate your audience with your presentation, you need visually appealing graphics. A dartboard is the perfect visual metaphor to present your message and hit the target (persuade the audience).


Dartboard is a swift and easy way to evaluate the aim of your enterprise. Your audience will feel the force of your determination. Impart a potent impact on your audience, colleagues or management team and highlight critical events along the way to achieve your goals. Ensure an accurate fit with your products and services. Target your clients among your team members. Everyone in your team should be clear about the business aim and objectives. Don’t simply tell them, show them with an eye-catchy Dartboard diagram.


This tutorial is for those professionals who consider creating a dartboard icon a hard nut to crack.


You’ll learn here to create this:

Dartboard Shape to highlight goals, targets, etc.


How to Create a Dartboard Template in PowerPoint:


Follow these simple steps to create the dartboard:

  • Go to the Insert tab > Shapes> select the Oval shape > press SHIFT + CTRL and drag to draw a symmetrical circle.

Insert Oval Shape


  • Now select the Oval shape, right click to get the Format Shape option. Next, go to Fill > No Fill > Line > Solid Line > Color > Dark Grey > Width 20pt (see the screenshot).

Edit the shape


  • Copy this shape twice by pressing CTRL and Shift keys together and drag towards the left direction.
  • Resize the other two circles using any of the corner handles. Press Shift + Control key while doing so that the symmetry of the circle is not disturbed.

Resize the circle


  • Insert these two circles within the bigger circle. To align them at equal distance, select all the three shapes > Format tab > Align > Align Center > Align Middle.

Align the Oval shapes in center and middle


Creating the Dart:


  • Select the Oval shape from the Shapes menu and create a small circle.
  • Select the Rounded Rectangle shape and draw a thin rectangle.
  • Use the rotating handle to rotate the rounded rectangle and place it over the circle (see the screenshot shown below).

Place rectangle over the oval shape


  • Now, select the Chevron Shape from the Shapes menu. Drag the yellow square box to expand the shape (see the screenshot below).
  • Select the altered chevron shape and rotate it.

Select the Chevron shape and rotate


  • Place this shape on the rectangular shape. After this, select all the shapes, go to the Format Tab > Merge Shapes > Union.

Select all shapes and merge them


The dart is ready! Give it the same color as the board (dark grey in our case) and place it in the center of the board. Make it stand out by giving it a thick outline. To do that, right click on the shape > Format Shape > Line > Solid Line > White Color > Width > 3.25pt.

Edit the arrow


You can customize the colors, thickness and layers of the dartboard as per your preference. Check out the impressive Company Goals slide below:

Company goals dart board


Not only this, you can also use the dartboard as an icon to represent strategies, objectives, aim and targets in your presentation. Since icon is very small in size, you need to resize the dartboard we have learnt to create. Select the board and the dart and group them together by pressing Ctrl + G. Now, press Ctrl + Shift and drag it inwards to have your dartboard icon. Check out how we have used this icon in one of our slides:

Dart board icon used in PowerPoint presentation


Professional Dartboard PowerPoint Templates:-


Looking for more amazing dartboard designs for your presentation? Then check out these professional designs made by our Presentation Design Services Team:


Dartboard Template Design #1

Target Dartboard PPT template

Click here and download this creative dartboard PowerPoint template.


Dartboard Template Design #2

Infographic desktop with dartboard

Download this stunning professional dartboard PPT from here.


Dartboard Design #3

Hit your target with awesome Dartboard Slide

Browse and download this exclusive Dartboard PowerPoint template by clicking here.


 Dartboard Template Design #4

Professionally Designed Dartboard Template

Download this exclusive dartboard PowerPoint design by clicking here.


 Dartboard Template Design #5

Stunning Mission Dartboard presentation template

Click here and download this stunning Dartboard template.


Template Design #6

Awesome four staged Dartboard PowerPoint template

Browse and download this awesome dartboard diagram from here.


Target Board Template Design #7

Target Analysis Dartboard Slide Diagram

Download this professional dartboard presentation template by visiting here.


Dashboard Template Design #8

Stunning Future Business Goals Dartboard PPT Template

Click here and download stunning dartboard presentation slide.


Use these Dartboard PowerPoint Templates and add bounty to your presentation. Feel free to share your feedback here.


PowerPoint Tutorial #15- 3 Customized Arrows That Will Strike the Right Chord

$
0
0

Arrows are probably as ancient as the first language. Their presence and usage to depict directions can be seen in ancient caves which were a habitat long before humans started speaking to each other.  Arrows have been a part of the communication system since ages and are one of the first things that a child learns in his early stages of education.


Arrows maybe as ancient as the first language


The only reason that arrows are still as common as they were then is the fact that they are visual, easier to understand and are not specific to any language. To mention directions to a place in each language might not be possible or practical but a universal arrow can do it better and with lesser resources. But can arrows help us in our PowerPoint presentation?


Universal Arrow Sign


They definitely can. Creatively designed arrows can not only enhance the visual appeal of your presentation, it can also reflect your creative side to the audience. Most successful presentations carry less text and more visuals and you can implement that with the help of arrows. Arrows can help explain steps of a process, hierarchy of a management, various stages, key issues, targets, and much more. But is it worth spending half an hour to create one arrow to be used in the presentation? Definitely not. But if the same or even more creative arrow can be created in 2-3 minutes then it’s definitely worth it. Following these steps you would be able to create different kinds of the most common used shape in PowerPoint presentation.


What You’ll Learn to Create in this Tutorial:

Customized Arrow Diagrams for Professional Look


Arrow 1

Types of Business Environment PowerPoint Slide


Follow these steps to create this amazing arrow diagram:


  • Insert a Bloc Arc. Go to Insert> Shapes> Basic Shapes> Bloc Arc.

Insert a bloc arc


  • Increase its size by dragging the corner handle as shown below in the image.

Increase the size of the bloc arc


  • Now hold the right yellow square box and decrease its width (see the below image).

Press the yellow cursor to decrease the width of the bloc arc


  • Place a Rectangle over the Block Arc. Go to Insert> Shapes> Rectangles> Rectangle.

Place a rectangle over the bloc arc


  • Now place a Triangle over the arc. Select Insert> Shapes> Basic Shapes> Triangle. You can also adjust the size of the triangle while placing it over the shape by reducing its size (see the below image for your reference).

Place a triangle and adjust its size


  • Select all the shapes and remove the outline. Right click the image> Outline> No Outline.

Remove the outline


  • Duplicate the original shape. Rotate the duplicate one and you will get a circular arrow diagram just like the one shown below.

Duplicate the image and rotate it


  • Fill the shapes with the color of your own choice.

Fill it with the color of your choice

Your professional and sophisticated arrow PPT slide is ready. Let's move on to the next one.


Related: Simplest Way to Create Circular Arrows in PowerPoint


Arrow 2

Steps of entrepreneurial process


  • Insert a Rounded Rectangle. Go to Insert> Shapes> Rectangle > Rounded Rectangle.

Insert a rounded rectangle


  • Adjust the size of the Rounded Rectangle by dragging the yellow handle towards right (see the below image).

Move the yellow handle to adjust the shape of the rounded rectangle


  • Place the Chevron shape above the Rounded Rectangle. Go to Insert> Shapes> Block Arrow> Chevron.

Insert a chevron


  • Select both the shapes. Go to Arrange> Align> Align Left.

Select both the shapes and align left


  • Increase the length of the Chevron and place it properly above the Rounded Rectangle. Copy the original Chevron and duplicate it. Place the second Chevron above the Rounded Rectangle (see the below image).

Increase the length of the chevron


  • Select the Rounded Rectangle and the Chevrons. Right click the image> Outline> No Outline.

Remove the outline


  • Fill the image with a color of your choice.

Fill it with color


Duplicate the arrow shape to have as many shapes as the steps in your slide. Let's move on to make the last arrow diagram.


Arrow 3

Four stages of marketing process


  • Insert a Chevron from the Shapes menu. Go to Insert> Shapes> Block Arrows> Chevron.

Insert a Chevron


  • Increase its size by holding the Shift key (see the below image).

Increase the size of the Chevron


  • Duplicate the original Chevron by pressing Control and Shift simultaneously.

Duplicate the original Chevron


  • Insert a Notched Right Arrow from the Shapes menu. Go to Insert> Shapes> Block Arrows> Notched Right Arrow.

Insert a notched right arrow


  • Increase the size of the Notched Right Arrow by holding the Shift Key.

Increase the size of the notched right arrow


  • Place the Notched Right Arrow over the first Chevron from right. You can use the Shape Effects tool while placing the Notched Right Arrow over the Chevron so that it is placed properly. To use the Shape Effect tool, select the Notched Right Arrow> Shape Effects> Preset> Preset 8.

Place the notched right arrow over the 1st chevron


  • Turn off the Preset. To do so, again select the Notched Right Arrow, go to Insert> Preset> No Preset. You will get an image just like the below image.

Arrow and chevron placed together


  • Select all the images and distribute them horizontally. Click the Format tab. Go to Arrange> Align> Distribute Horizontally.

Distribute all the shapes horizontally


  • Next step is to remove the outline. Select the shapes, right click> Outline> No Outline.

Remove the outline


  • Fill the arrows with colors of your choice. Right click the image> Fill> Color of your choice.

Fill it with color


These easy steps will help you create the most stunning Arrow Diagrams for your presentation. In case, you lack time, we have handpicked creatively designed Arrow PowerPoint Templates for you. Go through them and choose the ones that suit you best.


P.S. Learn to Create 3D Arrows in PowerPoint


Professional Arrow Diagrams 


Professional PowerPoint Template #1

Security software data services example of PPT

Grab this awesome template by clicking here.


Professional PowerPoint Template #2

Baseline performance measurement diagram powerpoint slides

Download this creative PowerPoint Template and stun your audience.


Professional PowerPoint Template #3

Description of diverging approaches using 11 arrows Circular Spoke Chart PowerPoint templates

Grab this eye catching diagram right here.


Professional PowerPoint Template #4

Different branding corporate identity ppt powerpoint slides

Download this innovative diagram, add your content and amaze your audience.


Professional PowerPoint Template #5

Essential managerial skills powerpoint templates

Catch this awesome diagram by clicking here.


Professional PowerPoint Template #6

Different marketing conversion rate optimization ppt templates

Click here to download this stunning diagram.


Professional PowerPoint Template #7

List positives and negatives pros and cons powerpoint presentation

Show pros and cons in a most stylish way ever. Click here to grab this awesome PowerPoint Template.


Professional PowerPoint Template #8

Five staged text business banner for text representation powerpoint template

Download this awesome diagram, add your content and logo and you are good to go! Click here to download this innovative PowerPoint Template.


Share your feedback with us. Stay tuned for more PowerPoint Tutorials.

PowerPoint Tutorial #16- The Simplest Way to Create a Light Bulb in PowerPoint

$
0
0

You see them everywhere- in your room, decorating the halls, hanging as chandeliers in hotels and restaurants brightening the ambience of the place. You also see it being used as the most popular symbol or icon of innovation, a brand new idea. The light bulb!


How do you showcase your ideas in a presentation? Bullet Points? A very bad idea. Illuminate the audience with a light bulb and spread the knowledge. An idea generation slide is incomplete without the bulb. If you have come up with a new marketing plan or new solutions to a critical problem in the organization, breathe energy into your words with this visual.


Let’s guide you step by step in creating the perfect light bulb in PowerPoint and flaunt your ideas!


You’ll learn here to create this:

Create a Light Bulb in PowerPoint.


Steps to Create Bulb Shape in PowerPoint


Step 1 : Create the bulb frame


  • Insert the Teardrop shape from the Shapes menu under Insert Tab. To enlarge the shape, select the shape > press Shift + Ctrl keys together> drag it outwards.
  • Now using the rotation handle on top, rotate it rightwards such that the pointed edge is facing down (see the screenshot below).


Insert teardrop and rotate it.


  • Next, pick the trapezoid Go to the Insert tab > Shapes > Trapezoid. Press SHIFT+CTRL and Drag.
  • After this, select the shape and go to Format Tab > Rotate > Flip Vertical (see the screenshot).


Insert and rotate the trapezoid shape.


  • Place this rotated Trapezoid shape over the Teardrop For accurate measurement, align them to centre. For this, select both the shapes, go to the Format > Align Centre.
  • Select both the shapes, go to Format Tab > Merge > click Union.


Merge the teardrop and trapezoid shapes


Step 2- Fill the bulb with a gradient


Select the shape, right click and select the Format Shape option.

  • For Fill: - Gradient fill > type – Radial > Direction – from Center > select color for Gradient1 in light yellow color and Gradient2 little darker > Position Gradient1 at 0% and Gradient2 at 80%.
  • For Line: - Solid Line > Color (same as you chose for gradient2 in Fill) > Width3.75.


Format the shape and fill color


Step 3 – Create the base of the bulb


  • Go to the Insert Tab > Shapes > Rounded Rectangle. Further, drag yellow square box and give edges a rounded shape.
  • Fill color in this shape, go to Format Shape > Fill > Grey > Line > No Line. (See the image below)

Insert and format the rounded rectangle.


  • Copy paste the shape thrice. Or simply select the shape -> press SHIFT+CTRL > Drag. Don’t forget to resize them as shown in the screenshot below.
  • Place these shapes vertically under the yellow bulb shape and align them. Select the yellow bulb and rounded rectangles > click the Format Tab > Align > Align Center > Distribute vertically.


Align the horizontal lines of Light Bulb.


Isn’t it an effortless task to do? However, if you want to enhance the graphics of this light bulb you can follow this last step:


Step 4 (Optional) - Create the Light Glow Effect


  • Insert an Oval shape from the Shapes
  • Place it over the bulb as illustrated in the image.
  • Next, select the shape, right click > Format Shape > Fill > Solid Fill > White > Transparency 60% > Line > No Line.


Give glow effect on light bulb.


Step 5- Create the wires and the filament


  • Draw a small rectangle. Insert Tab > Shapes > Rectangle.
  • Draw two lines as demonstrated in the screenshot. Go to the Insert Tab > Shapes > Line. Place them on the rectangle created.
  • Write your text, click the Insert Tab > Text Box > drag and write your text. Place it in between the two lines. Keep the font and size as you desire. We chose Monotype Corsiva font and 74” font size.
  • Lastly, select the rectangle and both the lines and give it the same grey color that you used for the base.


Fill the color in shapes.


Here you go with an innovative yet professional Bulb design to enlighten the mood of your audience.


Professional Light Bulb Templates:


Light Bulb Template Design #1

Financial Planning Bulb PPT SlideDownload this creative Light Bulb PPT slide from here.


Light Bulb Template Design #2

Semicircle Bulb Presentation TemplateClick and download this awesome Light Bulb PowerPoint template from here.


Light Bulb Template Design #3

Head Bulb PPT Presentation TemplateBrowse here and download this Light Bulb presentation slide design.


Light Bulb Template Design #4

Idea Generation Light Bulb PowerPoint SlideDownload this professional PowerPoint presentation Template by clicking here.


Light Bulb Template Design #5

Idea Transfer Strategy Light Bulb Presentation SlideClick download here and avail this stunning Light Bulb PowerPoint slide template.


Light Bulb Template Design #6

Business Process Bulb PowerPoint TemplateBrowse and download this innovative Light Bulb PPT presentation slide diagram.


Light Bulb Template Design #7

Target Light Bulb PPT TemplateVisit here and download this awesome Light Bulb PowerPoint template design.


Light Bulb Template Design #8

Segments in Bulb Presentation SlideDownload professional Light Bulb PPT template from here.


Light Bulb Template Design #9

Problem Solving Puzzel Light Bulb TemplateVisit here and download this problem solving Light Bulb PowerPoint template design.


Light Bulb Template Design #10

Idea Generation Bulb Concept PowerPoint PresentationDownload this idea generation Light Bulb PPT slide from here.


Stay tuned with more PowerPoint tutorials and keep sharing your feedback with us.

PowerPoint Tutorial #17- Create a Circular Hub Spoke Diagram in Just 5 Minutes

$
0
0

You have come to a place which is a one stop solution for your every problem related to PowerPoint presentations. Whether you are looking for a perfect business related template or looking for a relevant corporate theme. We have all in one place. SlideTeam.net offers diverse collection of innovatively designed PowerPoint templates and themes covering almost every field. Be it business, corporate, medical, computer, construction, information technology… list goes on. We can help you create a wonderful presentation for you to impress your audience. Not only this, if you are a PowerPoint presentation geek and you want to experiment a bit on PowerPoint, what you have to do is to follow our PowerPoint Tutorials. They will help you create awesome designs for your presentations.


Like today, we are going to tell you how you can create circular Hub Spoke in less than 5 minutes. You might have heard this name randomly like hub and spoke structure or spoke-hub paradigm.  But you might had not paid attention to it then. However, this PowerPoint tutorial needs your complete attention so that you can impress your boss and engage your audience. So let everything be and pay attention here.


The Hub Spoke diagram is a circle in a center and spokes moves along while connected to the hub at the center. The Hub Spoke diagram shows associations arranged in a circle. It is used to showcase the relationship connected to a central idea in a circular manner. Let’s say you want to showcase the features of your particular product, use the Hub Spoke diagram to display the features. It will be easier for the audience to comprehend what you want to say. Hub Spoke diagrams can also be used at various places such as to show the components of marketing, factors affecting the economy, key points of social media strategy, determinants of health and much more.


Follow the below steps and create an awesome customized Hub Spoke diagram.

What you will learn in this tutorial:

Types of Online Marketing


Steps to create Circular Hub Spoke:

  • Insert an Oval shape from the Shapes Go to Insert> Shapes> Basic Shapes> Oval. Press Shift + Ctrl to draw a perfect circle.

Insert an oval shape from the shapes menu


  • Insert two more circles in the first circle. Go to Insert> Shapes> Basic Shapes> Oval.

Insert two more oval shapes from the shapes menu


  • Align all the three circles. Select them, go to Arrange> Align> Align Middle.

Align all the three circles properly


  • Again, select all the three circles. Right click them, Outline> No Outline.

Select all the three circles and remove their outline


  • Right click the three circles. Fill them with the color of your own choice. Or use the colors we have used- Outer Circle (Dark Grey), Middle Circle (White) and Inner Circle (Light Grey). See the below image:

Right click the each circle and fill them with the color of your choice


  • Circle in the center is called a Hub. So we are half way in creating the Hub. Now is the time to give shadow to the circle (Hub). Right click the outer circle> Format Shape> Shape Options> Effects (2nd Option) > Shadow> Presets> Inner> Inside Top. (See the below image for your reference).

Give an inner shadow to the outer circle


  • Now select the inner circle in light grey color, right click the shape> Format Shape> Shape Options> Effects (2nd Option)> Shadow> Presets> Outer> Offset Diagonal Bottom Right. (See the below image).

Give an outer shadow to the inner circle


  • Leave the Hub aside. Let’s move on to create Spokes now. Insert a tear drop. Go to Insert> Shapes> Basic Shapes> Tear drop.

Insert a teardrop from the shapes menu


  • Insert a circle inside the tear drop. Go to Insert> Shapes> Basic Shapes> Oval.

Insert an oval shape in the teardrop from the shapes menu


  • Align the teardrop and circle. Select both the shapes> Arrange> Align> Align Center.

Align the teardrop and oval shape properly


  • Select both the teardrop and the circle inside it. (Not to be confused with the Hub). Right click the shape> Outline > No Outline.

Remove the outline from teardrop and oval shape


  • Select the circle present inside the teardrop. Right click the shape> Fill> White Color. (See the below image).

Fill the oval shape with white color


  • We have to play a little more with the inner circle of teardrop to make it more creative and professional. Right click the inner circle> Format Shape> Shape Options> Effects> Shadow> Presets> Inner> Inside Top. (See the below image for your reference).

Give  an inner shadow to the cirlce present in the teardrop


One spoke is ready. You can group the teardrop and the white circle inside it by using the shortcut Ctrl + G. To create more spokes, just copy paste the original one by pressing Control C and Control V and duplicate it to get more spokes. Place them around the Hub. Rotate them using the rotation handle on top and align them properly. For their alignment, take a look at the below steps.


  • Select the Hub (circle in the center) and the top and bottom spokes. Go to Arrange> Align > Align Center.

Align top and bottom spokes


  • Select the Hub (circle in the center) and the left and right spokes. Go to Arrange> Align> Align Middle.

Align left and right spokes


  • Select each spoke and fill it with the color of your own choice. You can first ungroup the teardrop and the circle enclosed within it by using the shortcut- Ctrl + Shift + G.

Fill the spokes with the color of your choice


Your circular Hub Spoke diagram is ready. Simply write down your content and present it confidently.

Types of Online Marketing


It is easy and simple to create. We bet it won’t take much of your time.


We have also handpicked some awesome Hub Spoke PowerPoint Templates for you which you can include in your presentation. Have a look.


Professionally Designed Hub Spoke Templates


Professional PowerPoint Template #1

Multistaged flower diagram for business application flat powerpoint design

Click here to download this awesome diagram.


Professional PowerPoint Template #2

App basic legal forms template example of ppt presentation

Grab this amazing Hub Spoke PowerPoint Template by clicking here.


Professional PowerPoint Template #3

Customer engagement programs powerpoint slides background

Grab this eye catching Hub Spoke PowerPoint Template.


Professional PowerPoint Template #4

Project life cycle development example of ppt presentation

Download this amazingly designed diagram, add your content and set a right impression on your audience.


Professional PowerPoint Template #5

Bp six staged colored arrows and icons in circle flat powerpoint design

Grab this professionally designed Hub Spoke PowerPoint diagram by clicking here.


Professional PowerPoint Template #6

Colorful infographics for data representation powerpoint template

Click here to download this creatively designed Hub Spoke PowerPoint Template.


Professional PowerPoint Template #7

New benchmarking research best practices presentation slides

Grab this amazing PowerPoint Template by clicking here.


Professional PowerPoint Template #8

Planning and demand forecasting diagram ppt slides

Grab this awesome Hub Spoke PowerPoint Template by clicking here.


Share your feedback with us. Stay tuned for more awesome PowerPoint Tutorials.

PowerPoint Tutorial #18- How to Create a Stunning Funnel Diagram for your Business Presentation

$
0
0

Funnel! Since, ancient times the conical object with wide mouth and narrow bottom is used in filtering or channeling the fine grained substances. No, here we are not going to talk about its benefits in household or other activities, but in business presentations!


You have read it right. At present, funnel has become a common jargon in the corporate world too. Be it for sales funnel, marketing funnel, purchasing, lead generation, or launch funnel…name it and you have a diagram available. To evaluate the success and analyze the sales, score leads and prospects, they are apt visuals. Funnel diagrams in PowerPoint allow you to explain proportions more easily, in other words indicate that some quantity goes from a large number to a small number.


Sadly, many professionals employ the same old method of depicting stages of a process with bullet points. Not only this looks unprofessional, but also fails to catch eyeballs for your presentation. Right! Wondering what you can do to have a tight hold on your audience? Fret not. We have an easy solution to it. That is, learn to create your own funnel and a professional slide. :-)


Here you'll learn to create:

Funnel Diagram Template


Steps to Create a Funnel in PowerPoint:-


  • Draw a triangle. Go to the Insert Tab > Shapes > Triangle.
  • Select the triangle > go to the Format Tab > Rotate > click Flip Vertical or simply use the rotation handle on the top of the triangle.


Insert and rotate the triangel


  • Take a Trapezoid shape from the Shapes menu in the Insert Tab. Rotate it using the same steps: go to the Format Tab > Rotate > Rotate Vertical.

Insert and rotate Trapezoid Shape.


  • After this, place it over the triangle shape as shown in the screenshot below. You can align them to center by selecting both the shapes > Format Tab > Align > Align Center.
  • Further, select both shapes and merge them together. Go to the Format Tab > Merge Shapes > Union.

Align shapes to center and union them.


  • Place three rectangles of smaller width on the merged shape as shown in the below given image. Select Rectangle from the Shapes menu in the Insert Tab.

Insert three rectangles.


  • To place them at equal distance, first select the shape > press SHIFT Key and select three rectangles > go to the Format Tab > Align > Distribute Vertically.

Distribute rectangles vertically


  • Now, first select the union shape and then the rectangles using the Shift key, click the Format Tab > once again go to the Merge Shapes menu > select Fragment.

Fragment the shape


  • Select the fragmented rectangular shapes inside the funnel and press delete to get the shape as you see below:

Shape after deleting the fragmented rectangles.


  • Place a rounded rectangle over the shape. Go to the Insert Tab > Shapes > Rounded Rectangle.
  • Make the rectangle more curved by dragging the yellow square box towards right as shown below:

Rotate the rounded rectangle and place it over the shape.


  • Next, insert oval shapes as shown in the screenshot. To do so, go to the Insert Tab > Shapes > Oval Shape. Press Shift + Ctrl Keys and drag to copy the shape.

Insert Oval Shapes


  • Now, all that you need to do is fill colors. Select the shape you need to fill, right click, go to Format Shape > Fill > Solid Fill > Color (select the color of your choice) > Line > No line. Follow the same steps for all the shapes.

Format Colors in the Funnel


You can group all these separate elements into one shape. For that, hold the Shift key and select all the shapes and then use the shortcut for grouping objects- Ctrl + G.


Want to give 3-D look to your Funnel? Then, you are just one step away. Follow these simple steps and create a three dimensional funnel:-

  1. Go to the Insert Tab > Shapes > Rectangle.
  2. Place this rectangle on the left half of the funnel created.
  3. Right click on the rectangle> Format Shape > Fill > Color- White > Transparency- 86% > Line > No Line.

Insert rectangle on funnel and give 3D look


Delight your customer with this visually appealing funnel and create a top notch presentation.


Professionally Designed Funnel Diagram Templates


Funnel Template Design #1

Three Level Funnel ProcessDownload this professional conversion funnel diagram from here.


Funnel Template Design #2

Filter Process Funnel Diagram PPTClick here and download this awesome Funnel PowerPoint Template.


Funnel Template Design #3

Customer Life Cycle Funnel PPT slideDownload this Customer Lifecycle Funnel presentation template from here.


Funnel Template Design #4

Sales Process Funnel PowerPoint TemplateBrowse this awesome Sales Funnel PowerPoint template by visiting here.


Funnel Template Design #5

Key Sales Initiative PPT DiagramClick here and download this stunning marketing Presentation Design.


Funnel Template Design #6

Awesome Sales Initiative Slide TemplateVisit here and download this exclusive web marketing Funnel Diagram Slide.


Funnel Template Design #7

5 Staged Lead Generation Funnel Diagram PowerPoint Download this stunning lead generation Funnel Presentation Slide Template.


Funnel Template Design #8

Stunning Funnel Diagram PowerPoint SlideVisit here and download this infographic Idea generation funnel diagram.


Funnel Template Design #9Funnel Process for Data FlowBrowse here and download this data flow funnel process PPT.


Funnel Template Design #10

Recruitment process Funnel DiagramDownload this awesome Selection Funnel Process PowerPoint Slide Template.


Share your feedback with us here.


11 Hacks to Make Text Over Images More Readable & Craft a Stunning Slide

$
0
0

Title Slide is the most important slide in your presentation. It’s the introduction- your first impression. You want the audience to immediately sit straight, keep their phones away, open their eyes and ears and look forward to the next 20 minutes of your presentation.


If you are using a great, full screen visual on the title slide, half the battle is won. There is nothing better than opening the opening slide with a striking image. But often a small problem crops up over here- How to display text over an image? The title is barely readable on the colorful image! Not only is your title getting lost somewhere in the slide, it’s killing the beauty of the image too.


You aren’t the only one, every designer has faced this problem. It happens when there is hardly any or very little white space in the image. Or the image may be a bit busy.


That problem will now be solved. Here are 11 design tips to make your text more readable on a busy, colorful image and create an outstanding opening slide or any slide with a full-screen image:


Hack #1- Add a Transparent Shape Behind the Text

The easiest way to make your text stand out is to add a transparent layer behind it. Many of you might know it already and are looking for better ways; you’ll find more further. It might be a simple hack but very effective.


Check out this slide where we faced the text problem. Donald Trump is taking up all the space on the slide!
BEFORE:

Donald Trump won't be impressed as his 2016 presidential campaign is getting lost in the background


Can’t give it a thumbs up to this slide however! Average readability but poor aesthetics. No point in blaming Donald Trump for everything. It is a design problem that requires a simple fix. Simply insert a rectangle from the Shapes menu (go to the Insert tab), right click and select the Format Shape option. Now give the rectangle a solid fill of color black and set transparency of around 25% so that the content stands out and Trump is not blocked too. Check out the after slide:


AFTER:

Transparent banner added behind the text- Slide looks great and Donald Trump too


There are 2 things we did more than just adding a shape:


  • Chose a thicker font- Century Gothic font size 72 and made Bold
  • Added a red line above and below the shape (width 2 point)


P.S. Ensure that if the image is of some personality, you do not block off the person’s face. Not just Donald Trump, anybody would not like that.


Hack #2- Add a Transparent Layer over the Image

As much as Donald Trump remained in the headlines, so did Brexit: the shocking exit of Britain from the European Union. The outcome had global repercussions; not just for the UK economy. But while creating the opening slide for it, we faced the same problem.


BEFORE:

Brexit news is barely readable on this colorful, flag-filled background


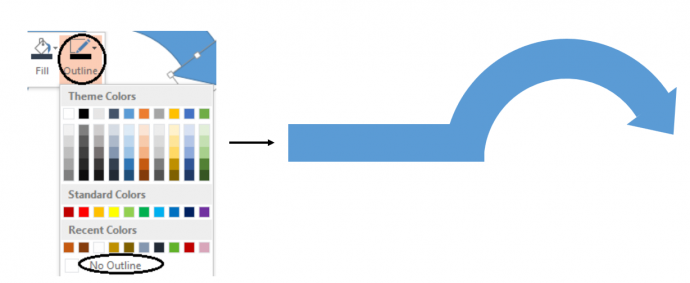
Many a times when you try hack #1, you might feel it looks forced and awkward. It does not gel as well as it looks in the Donald Trump slide. The image in the background is such that if some part of it is blocked by text and transparent shape, the slide becomes a mess. Same was the case with the slide above. In such a scenario, take a rectangle from the Shapes menu in PowerPoint and cover the complete visual with it. Now, format the shape, change the color of the shape, set transparency level and remove the outline. Here’s how the Brexit opening slide now looks after applying hack #2-


AFTER:

Breaking news impact is generated with a dark layer on the background and bold, large text


Hack #3- Use Whatever White Space

When the characters in your visual cover the entire space leaving you with no space to write your text, you are left with no option but to put it over that central character. Pretty much like the Donald Trump slide. But some images are too precious and remarkable to be tampered with. Like an outer space image. Juno’s mission to Mars is a remarkable achievement. But does this slide look remarkable after text is forcefully inserted over the planet?


BEFORE:

Jupiter looks inhabited by black aplhabets


The Jupiter seems to be invaded by a boring font. Thankfully, the image has some white space on the right. Something is better than nothing. Take a cool font worthy of depicting galaxy. Check out the slide now:


AFTER:

The Juno Mission is a success and so is the slide


The font size is small yet so readable. Besides, the tiny font adds more meaning to the slide, which is to admire the vastness of space. Keep the sub-heading of a different color, preferably picked from the visual itself.


Hack #4- Try Masking

The problem is the same- text seems to rob the beauty of a stunning image.


BEFORE:

Construction Industry text is merging into the background


Readability is not that bad, although one has to concentrate a lot. Make it easier for the audience by masking. If we put a transparent layer from left to right, the young man’s face will be cut off. The bottom half is too busy to add title over there. The placement is fine. In masking, we gradually keep decreasing the transparency of the shape till it merges into the picture. It looks very professional, see for yourself below:


AFTER:

Masking is a great design tip, isn't it?


Here’s how you create the masking effect: Take a rectangular shape and fill it with a Gradient Fill. Choose the color you wish to use and keep 3-4 gradient stops. Keep increasing the transparency of each gradient stop till the last gradient stop has 100% transparency. See the screenshot below to see how we created the masking effect:

How to Create the Masking Gradient Effect in PowerPoint


Hack #5- Use Interesting Shapes

That happiness when you find the perfect visual for your presentation is often short-lived when you place text over it. The elements in the visual take a toll on text readability. As it happened in the slide below:


BEFORE:

Visual is wow, but slide is not thanks to the ugly text


No matter how bold and large you make the font, it will look forcefully placed over the stunning image. Transparent layer trick can work but still something will be missing. In such a scenario, the best hack is to use an interesting shape that gels with the personality of the slide. See what we did:


AFTER:

Slide also looks WOW with a perfect headline and visual


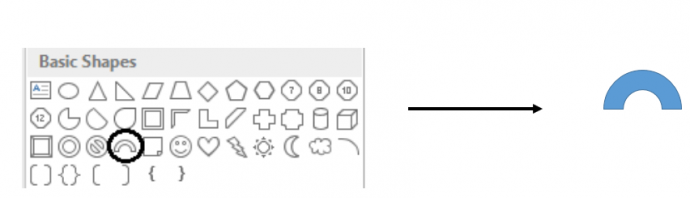
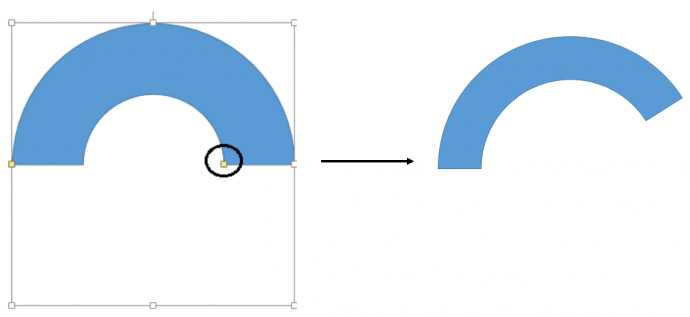
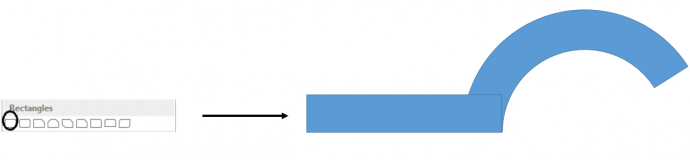
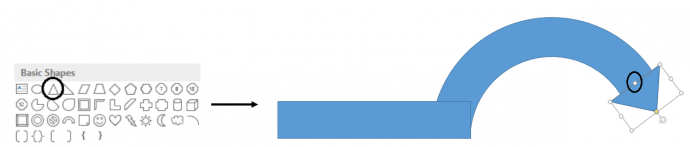
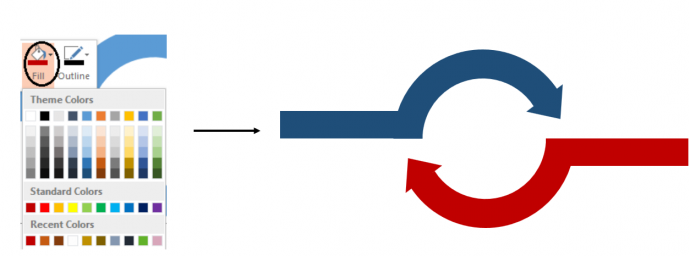
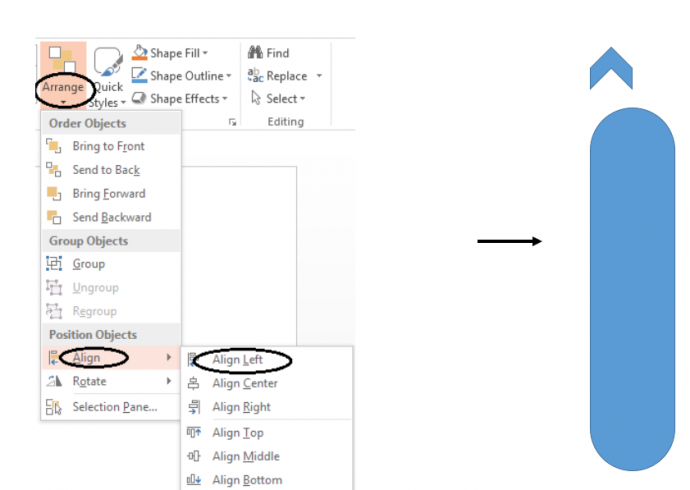
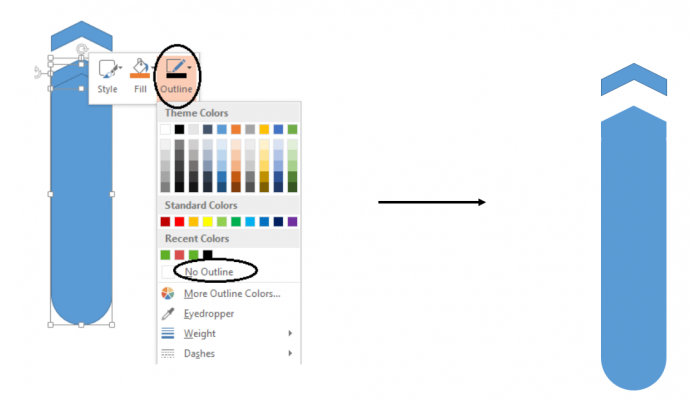
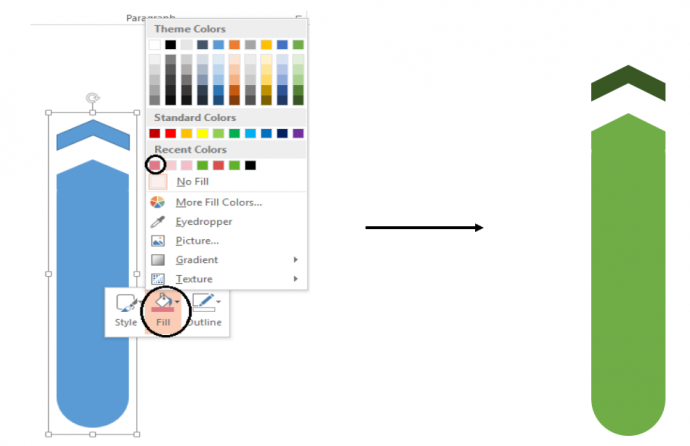
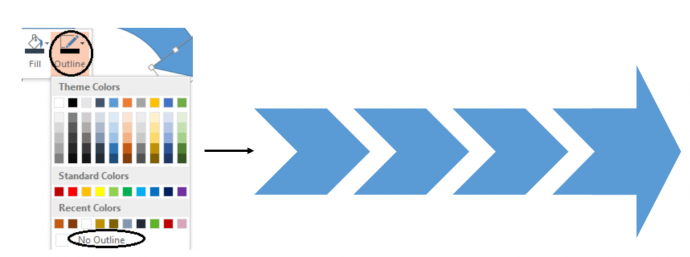
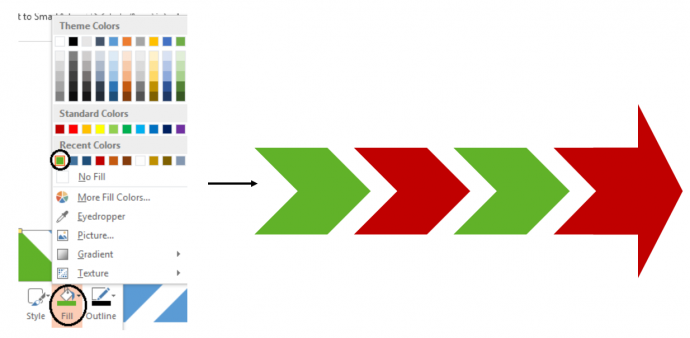
We have changed the fonts but even if we did not do that, any Sans Serif would look readable and impressive on the shape. We have not done much except take 2 circles- remove the fill of the inner circle and give it a white outline. We added a Chevron shape behind the circle (available in PowerPoint in the Shapes menu). The colors have been picked from the visual itself to complement and create a harmonious look and feel.


Hack #6- Use Ribbons/Strips

Adding simple strips over the image balances out the slide. You are able to give equal weightage to the image as well as the slide.


BEFORE:

The text looks forcefully placed in the corner of the slide


In the above image, masking or transparency won’t look good. There is already quite a lot of transparency thanks to the dust being blown around by the fitness trainer. So what we did was take a basic rectangle shape from the default Shapes category in PowerPoint, use colors from the image background, and tilt the shape to give it prominence. See the final effect below:


AFTER:

The strips of text enhance the look of the slide


Just a simple rectangle shape lends sophistication to the slide. Sometimes, you do not want balance. You want the image to speak everything. The strips of text can be made shorter to attain that effect. Here’s another example where a simple text box fill can get you out of a difficult design situation:


BEFORE:

Slide looks amateurish despite a nice visual


Notice the subject- Depression. Feeling small and pitied against the world. You do not need a big font to scream for attention. A small yet readable font will add meaning to the message. Check out the after slide now:


AFTER:

Strips of text lend sophistication to the slide


Hack #7- Use Pattern Fill

While we had used a Solid Fill to color the text boxes in the last hack, we’ll use a pattern fill here. PowerPoint offers several pattern fill options that can be used for background or shapes. A word of caution however. This hack should only be used for light hearted presentation topics. Now, in the image below, there is a serious problem of readability of content:


BEFORE:

Eeeks! Reading the text would cause dizziness


A solid fill behind the text would make the already so colorful image even more colorful. So we took a light pattern fill to match the look and feel of the image. We took a rectangular shape again, made it touch the edges of the slide and tilted it to make it stand out and trendy. Here’s how it looks:


AFTER:

So much better thanks to the pattern fill


Hack #8- Use Line Separators

Let’s take up a very easy and commonly used design trick that professionals use to make their content stand out without fiddling much with the image. Say you have an awesome visual topic like the Instagram slide below:


BEFORE:

Good but not a perfect instagram slide


The text is readable but can be made better just by adding a line or rectangle shape over and below the text. You can even give a light Glow Effect to the text. Select the text, go to the Format tab on the Ribbon, click Text Effects and under Glow, choose the glow color you wish to give. We gave a gray glow effect. Check out the after slide now:


AFTER:

Yes, this is perfect! Pro and classy


Hack #9- Use any Creative Element

Many a times, the image that you use in your slide gives you several creative options to place your content. You will understand it better when you check this slide below:


BEFORE:

Slide looks bland, uninspiring and unproductive


Do you notice the blank laptop screen screaming for attention? That’s the place you need to be placing your content. With slight rotation and tweaks, you can proudly display your headline like in the after slide below:


AFTER:

Opening slide looks outstanding with this creative hack


Hack #10- Apply a Color Filter

Filters aren’t just for Instagram. You can apply them to your presentation images too. PowerPoint may not have advanced filters like those in photo editing softwares but decent enough to change the look and make your content readable if it is not. Say you have a cover image like this one:


BEFORE:

Text is lost and so is the audience interest


Text is merging into the background. You can add a transparent shape behind the text but that won’t be the best hack for this slide. How about adding a color overlay! Select the image, go to the Format tab on the Ribbon and check out the Color options from the Color menu. You can recolor the image and change the color saturation and tone with simple clicks. Not only will your image look more professional and artistic but your text readability will improve by leaps and bounds too:


AFTER:

A color overlay enhances the look and feel of the slide


Hack #11- Blur the Image + Text All Caps

Many a times, you want to use an image simply to set the mood. There is nothing in the image that warrants attention from the audience. That is where you can use this hack. Say you have a general topic on books like the slide below:


BEFORE:

Must Read text is becoming too difficult to read


The rack of books sets the perfect tone for the slide and is quite perfect in itself, except for the fact that it takes a toll on the readability of heading. Why not blur the image? As it is, you don’t want the audience to start guessing the books in those rack. PowerPoint offers the Blur effect under Artistic Effects menu (Format tab). You can customize the intensity of the blur further from the Artistic Effects menu (click Artistic Effects Options) and increase the radius of the blur. When you do this, also don’t forget to make the heading all capitals, with bold and shadow applied to it so that it stands out from the background. Isn’t the slide below much better:


AFTER:

Blurred background makes it so much easier to read the title


There can be many more ways to increase the readability of content over a busy image. Now all these would not have been required if the image had plenty of blank space to type your content. However, this is an ideal situation. Often you will have to make do with images like those above. That’s where these hacks will come in handy to you.


BONUS TIP: Combine one or more hacks to create powerful, visually stunning and legible slides.


For instance, you can combine the Colored Transparency and Line Separator hack to create a stellar opening slide like the one below:


Everything is perfect in this slide, thanks to minor tweaks!


Did we leave out any design hack to increase text legibility? And which hack did you like the most? Type it down in the comments below.

PowerPoint Tutorial #19- How to Create Matrix Template for Your Presentation

$
0
0

Clock is ticking. Sun is drowning. It’s 5 P.M. in the evening. The first thing your boss told you in the morning is to have your presentation ready by tomorrow. You are on your desk. Opened many slides in PowerPoint but nothing worked out. That’s because you are not familiar with the new ideas around.


We are always here to help you out with your PowerPoint presentations. Our professional designing team creates awesome templates for you and our easy, innovative PowerPoint Tutorials help you create awesome designs for yourself.


Today, we are going to help you create Basic Matrix PowerPoint Template. These can be used to allocate responsibilities for different functions or it can be used to explain any processes given in separate boxes. Matrix designs can be put to a good use of highlighting information flows, tasks and activities. Create Matrix diagram to showcase the product development processes, SWOT Analysis, social media strategy, matrix algebra, and much more.


Although Matrix style is already incorporated in PowerPoint by default, those styles are used so often that it looks monotonous now. We bring you different styles of innovatively designed Matrix presentation templates which are shortlisted at the end of this post.


However, first let’s just learn to create a Basic Matrix PPT Template. Open up your PowerPoint and follow the simple steps given below.


What you will learn in this tutorial:

Ansoff Product- Market Growth Matrix


Steps to create Simple Matrix PowerPoint Template:

  • Insert two Up Arrows from the Shapes Go to Insert> Shapes> Block Arrows> Up Arrow. Place them as shown below in the image (one Up Arrow vertically and the other one horizontally).

Insert two Up arrow shapes


  • Select both the Up Arrows and remove their outlines. To do so, right click both the Up Arrows, Outline> No Outline.

Remove the outlines of the Up arrows


  • Place four rectangles as boxes inside the arrows. Go to Insert> Shapes> Rectangles> (See the below image for your reference).

Insert four Rectangles as boxes


Make sure boxes do not go out of the given Arrows area.

  • Change the outline color of the boxes (Rectangles). Right click the Rectangles, Outline> White Color.

Give white outline to the Rectangles


  • Give the shadow to the Rectangles. Right click the Rectangles, Format Shape> Shape Options> Effects> Shadow> Presets> Outer> Offset Center.

Give shadow to the Rectangles


  • Fill the boxes with the color of your own choice. Right Click the box, Fill> Pick a Color.

Fill the boxes with the color of your choice


  • Change the color of the Arrows as well. Right Click the Arrows, Fill> Pick a Color.

Change the color of the Up Arrows


The customized Basic Matrix PowerPoint diagram is ready. And is ready to be served in your presentation.

Ansoff Product- Market Growth Matrix


As we told you in the beginning, Basic Matrix PowerPoint Template can be used for various purposes. You can utilize this diagram to show the SWOT Analysis also.

Swot Analysis


It looks impressive. Isn’t it?


How much time did it take? Merely, 5 minutes of yours. It is easy and simple to create. So don’t let your time and efforts go in drain and get back to work. Create this simple yet attractive Basic Matrix and save yourself for tomorrow’s presentation.


We have picked the most searched Matrix PowerPoint Templates of our website for you. These Matrix PowerPoint Templates are highly in demand and are most frequently used by our customers.


Most Popular Matrix PowerPoint Templates of SlideTeam


Life Cycle Matrix PowerPoint Template:


Life Cycle Portfolio Matrix is one of the most searched Matrix PowerPoint Template. It describes the development of the product. How a product emerge, grow and at last decline. Use this awesomely designed Life Cycle Portfolio Matrix PowerPoint Template to determine your company’s product life cycle.

Life Cycle Portfolio Matrix 01 powerpoint presentation slide template

Click here to download this diagram.


Ashridge Fit Matrix PowerPoint Template:


Ashridge Fit Matrix is used to assess the attractiveness of potential procurement target or existing business to the parent. This matrix has two variable on which the attractiveness of the business is to be judged.

Ashridge Fit Matrix powerpoint presentation slide template

Grab this creative and unique diagram by clicking here.


Ansoff Product Matrix PowerPoint Template:


This the design that we taught you in our tutorial. Ansoff Product Matrix is very popular in the business world. It is a strategic planning tool used by the businessmen. Ansoff Product Market Matrix provides framework to help executives, senior managers, and marketers devise strategies for future growth.

Ansoff Product Matrix powerpoint presentation slide template

Strategize your company’s future growth with the help of Ansoff Product Matrix PowerPoint Template. Get this template right here.


BCG Matrix PowerPoint Template:


Use this creative BCG Matrix Template which focusses to identify high-growth prospects by categorizing the company's products according to growth rate and market share. This is a commonly used growth Matrix design in presentations.

BCG Matrix Powerpoint Template Slide

Add this creative BCG Matrix Template in your presentation and stun your audience.


GE Mckinsey Matrix PowerPoint Template:


Another commonly used Matrix PowerPoint Template is GE Mckinsey PowerPoint Template which evaluates business portfolio and provides further strategic implications.

GE McKinsey ornament

Click here to download this diagram.


Threat Matrix PowerPoint Template:


Threat Matrix is used as a strategic analysis tool which helps to evaluate the threat of a potential or impending competitor action or market event.

Threat Matrix powerpoint presentation slide template

Grab this template by clicking here.


Activity Matrix PowerPoint Template:


Activity Matrix is incorporated in presentations because it is a planning tool which helps to keep the tab on the activities happening related to the products.

Activity Matrix powerpoint presentation slide template

Click here to download this diagram.


Matrix Organizational PowerPoint Template:


This is also one of the most searched Matrix PowerPoint Template. Matrix Structure Template helps you present the structure and designations in a most creative manner.

Matrix Organizational Structure Powerpoint Presentation

Grab this simple yet attractive PowerPoint Template by clicking here.


Don’t let them go. Grab these amazing Matrix PowerPoint Templates. In case, you are looking for some basic and simple Matrix PowerPoint Templates, we have shortlisted some of our professionally designed Basic Matrix PPT Templates just for you.


Take a look.


Professionally Designed Matrix Templates


Professional PowerPoint Template #1

View brand extension powerpoint templates

Grab this stylish Matrix PowerPoint Template by clicking here.


Professional PowerPoint Template #2

Matrix chart for analysis flat powerpoint design

Add your content and logo, and you are good to go. Grab this awesome template right here.


Professional PowerPoint Template #3

Custom evaluation of business powerpoint layout

Download this creative Matrix PowerPoint Template and stun your audience.


Professional PowerPoint Template #4

View business acquisition strategy template powerpoint slide ideas

Click here to download this amazing Matrix PowerPoint Template.


Professional PowerPoint Template #5

Data interpretation visualization for business flat powerpoint design

Grab this eye catching Matrix PowerPoint Template and leave your audience stunned.


Share your feedback with us. Stay tuned for more amazing PowerPoint Tutorials.

How to Design The Perfect Product Launch Presentation

$
0
0
Product launch is a BIG thing. Brief all business teams and key stakeholders with your product launch strategies, product features and specifications,

How to Create a Pop Out Effect in PowerPoint

$
0
0
Pop out effect makes your PPT presentation visually appealing. Show your best festive offerings, an insight into your product or reveal a startling fact.

How to Create Click to Zoom Effect in PowerPoint

$
0
0
Learn to create Click to Zoom Effect where you can immediately grab your audience’s attention towards the most important thing you think.

10 Simple Steps to Create a Stunning Filmstrip Effect in PowerPoint

$
0
0
Use filmstrip effect to display targets of business and sales, portray your organization and unit profile, show company’s milestones, and project details.

How to Create Cue Cards in PowerPoint in Just 5 Minutes

$
0
0
Cue cards which are commonly used by people. Easy to carry, easy to use and very helpful in taking the notes. Learn to create Cue Cards in PowerPoint.

5 Steps to Create a Calendar in PowerPoint and Add Reminder Notes To It

$
0
0
Calendar plays an essential role while managing activities and schedules in our day-today life. Display specific record and appointments with Calendar PPT

3 Quick Fix Ways to Enhance Your Images in PowerPoint

$
0
0
Learn quick fix ways to enhance your images. Learn ways to enhance your pictures in PowerPoint Presentation.

Create an Elegant 3D Circle For Your Presentation in 7 Easy Steps

$
0
0
3-d circle is visual metaphor that Represent step by step actions of your strategic plan, administration, business process, strategies, and decision making.

Complete Slide Makeover: Boring Bullet-Points to Sexy Slides

$
0
0
Give your PowerPoint slide a complete makeover using these design tips. Turn boring bullet point slides into sexy ones without any designers' help.

How to Remove Background from an Image in PowerPoint

$
0
0
Learn how to remove the background in PowerPoint in just simple steps and get your audience's attention towards your presentation.
Viewing all 4719 articles
Browse latest View live